Image Details
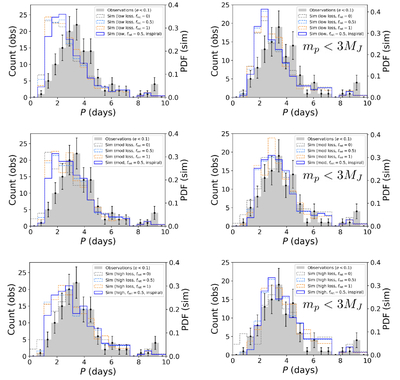
Caption: Figure 8.
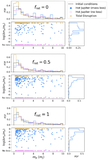
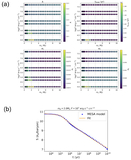
Comparison between the observed (displayed in counts) and simulated (displayed as a probability density function) period distributions. The shaded gray histogram shows the period distribution of observed hot Jupiters with e < 0.1. The period distributions for the simulated hot Jupiters are shown (dashed gray corresponds to fret = 0, dashed blue to fret = 0.5, and dashed orange to fret = 1). Solid blue curves show the distributions with systems that undergo inspiral and merger within ∼109 yr removed, for the fret = 0.5 case in each panel. The top row corresponds to the low-loss case, the middle row to the moderate-loss case, and the bottom row to the high-loss case. The left column includes all planetary masses, while the right column is restricted to only planets with mass <3MJ.
Other Images in This Article
Copyright and Terms & Conditions
© 2026. The Author(s). Published by the American Astronomical Society.