Image Details
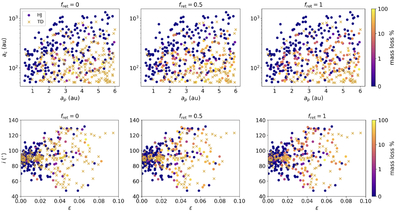
Caption: Figure 5.
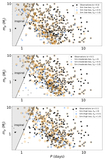
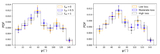
Top row: mass-loss percentages as a function of initial ap and ac in the moderate-loss simulations for fret = 0 (left), fret = 0.5 (middle), and fret = 1 (right). Surviving hot Jupiters are shown with circles and tidal disruptions with an orange crosses. The color-coding corresponds to the fraction of mass lost, with warmer colors indicating higher fractions of loss. Blue circles indicate either no or very little mass loss, violet circles correspond to ∼1% mass loss, orange circles to ∼10% mass loss, and yellow circles to nearly complete mass loss while surviving as a hot Jupiter. Bottom row: mass-loss fraction as a function of initial ϵ and i. The color-coding is the same as in the top row.
Other Images in This Article
Copyright and Terms & Conditions
© 2026. The Author(s). Published by the American Astronomical Society.