Image Details
Caption: Figure 2.
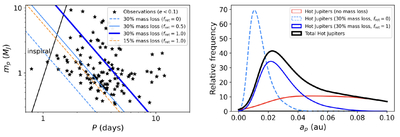
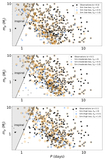
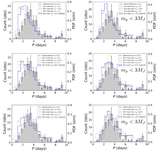
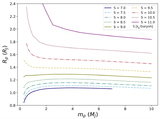
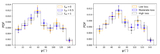
Left: mass–period distribution for observed hot Jupiters (black stars) that are relatively circularized (measured eccentricities <0.1). The observed sample of hot Jupiters is taken from the NASA Exoplanet Archive (accessed 2025 August 22; e.g., R. L. Akeson et al. 2013; NASA Exoplanet Archive 2025). We select systems with 0.3MJ < mp < 10MJ and ap < 0.1 au. The analytical thresholds from Equation (14) are shown for 30% mass loss, with fret = 0 (dashed light blue line), fret = 0.5 (solid light blue line), and fret = 1.0 (solid dark blue line). We also show the threshold for 15% mass loss with fret = 1.0. The threshold for inspiral and merger from stellar tidal dissipation is shown with a solid black line, calculated using the calibration from B. M. S. Hansen (2010). Right: semimajor axis distribution for hot Jupiters from the analytical model, smoothed using a Gaussian kernel. The solid red histogram shows systems that become a hot Jupiter with no mass loss. The dashed light blue line shows systems that undergo loss with fret = 0, and the solid dark blue line shows the same systems with fret = 1 (assuming 30% mass loss). The total hot Jupiter population from the model (both with and without mass loss) is shown with a solid black line.
Other Images in This Article
Copyright and Terms & Conditions
© 2026. The Author(s). Published by the American Astronomical Society.