Image Details
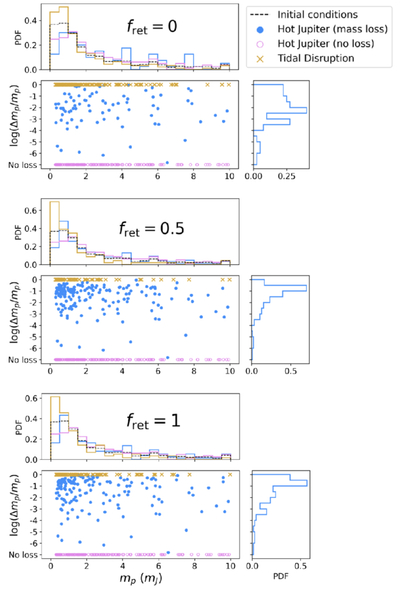
Caption: Figure 6.
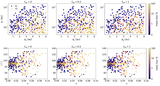
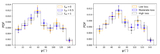
Mass-loss fraction as a function of initial planetary mass in the moderate-loss simulations. Hot Jupiters that undergo mass loss are shown as blue dots, hot Jupiters that undergo no mass loss as violet open circles, and tidal disruptions as orange crosses. The angular momentum return fraction is varied from fret = 0 (top), to fret = 0.5 (middle), and fret = 1 (bottom). For each choice of fret, we show the marginal histograms of the mass distributions (top) and mass-loss fractions of hot Jupiters that undergo mass loss (right), using the same color-coding. The initial mass distribution is shown with a dashed black curve. We see that low-mass planets undergo frequent tidal disruption. As angular momentum increases, more planets are “saved” and survive as highly stripped hot Jupiters.
Other Images in This Article
Copyright and Terms & Conditions
© 2026. The Author(s). Published by the American Astronomical Society.