Image Details
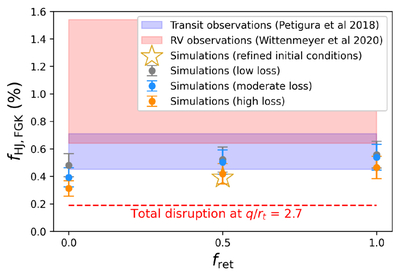
Caption: Figure 4.
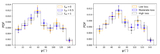
Comparison of the hot Jupiter occurrence rate from the transit observations of E. A. Petigura et al. (2018; shaded blue region), radial velocity observations of R. A. Wittenmyer et al. (2020; shaded red region), and those estimated from the simulations in this work. To obtain the simulated occurrence rates, we use the fraction of FGK stars in wide binaries from D. Raghavan et al. (2010) and the fraction of systems that harbor cold Jupiters as a source population in B. J. Fulton et al. (2021), then multiply by the fraction of cold Jupiters that become hot Jupiters in our simulations (given in Table 1). We show the rates for the varying mass-loss prescriptions of low loss (gray points), moderate loss (blue points), and high loss (orange points) as a function of varied angular momentum return fret. The rate for the M0.5set2 simulations (moderate loss, fret = 0.5, Set 2 initial conditions) is shown with a gold star. The occurrence-rate estimate from the NoLoss run is also plotted (dashed red line), which uses the approach taken in previous studies of removing planets that graze q/rt = 2.7 (e.g., C. Petrovich 2015b; G. C. Weldon et al. 2025).
Other Images in This Article
Copyright and Terms & Conditions
© 2026. The Author(s). Published by the American Astronomical Society.