Image Details
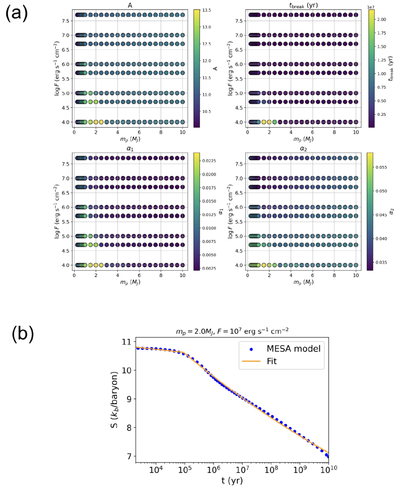
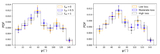
Caption: Figure 10.
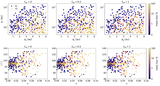
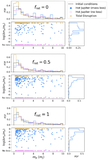
Panel (a): the fitted parameters in Equation (A1) from MESA evolutionary models. The color-coding shows A (top left), tbreak (top right), α1 (bottom left), and α2 (bottom right) as a function of the logarithm of stellar flux and the planetary mass. Panel (b): example fit to a MESA cooling curve using the fit parameters from panel (a) for a 2.0MJ planet with a stellar flux of 107 erg s−1 cm−2.
Other Images in This Article
Copyright and Terms & Conditions
© 2026. The Author(s). Published by the American Astronomical Society.
Copyright ©
2026 Astronomy Image Explorer. All Rights Reserved.