Image Details
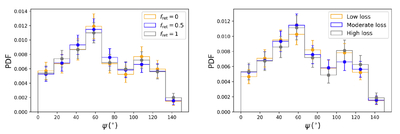
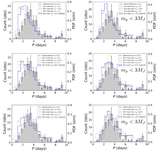
Caption: Figure 11.
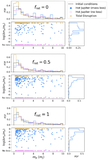
Left: distributions of stellar obliquities ψ for hot Jupiters in the moderate-loss numerical simulations. The orange curve corresponds to fret = 0, the blue curve to fret = 0.5, and the gray curve to fret = 1. Right: distributions of obliquities for hot Jupiters in the simulations with fret = 0.5. The orange curve corresponds to the low-loss prescription, the blue curve to moderate-loss prescription, and the gray curve to the high-loss prescription.
Other Images in This Article
Copyright and Terms & Conditions
© 2026. The Author(s). Published by the American Astronomical Society.
Copyright ©
2026 Astronomy Image Explorer. All Rights Reserved.