

Image Details
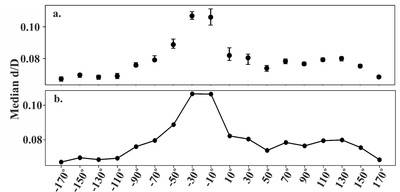
Caption: Figure B1.
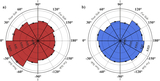
Results from (a) bootstrap and (b) equal-count subsampling statistical tests. The median d/D per each longitude bin (20°) is shown with black circles. The error bar in Figure B1 represents the confidence interval of the resampled medians after 5000 iterations.
Other Images in This Article
Show More
Copyright and Terms & Conditions
© 2026. The Author(s). Published by the American Astronomical Society.

Copyright ©
2026 Astronomy Image Explorer. All Rights Reserved.
