

Image Details
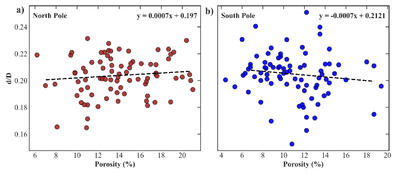
Caption: Figure 5.
d/D distribution with respect to porosity for the (a) north and (b) south poles. Individual points represent fresh craters, with porosity values derived for the corresponding crater locations. Dashed lines show least-squares linear fits of the form y = mx + c for each pole.
Other Images in This Article
Show More
Copyright and Terms & Conditions
© 2026. The Author(s). Published by the American Astronomical Society.

Copyright ©
2026 Astronomy Image Explorer. All Rights Reserved.
