

Image Details
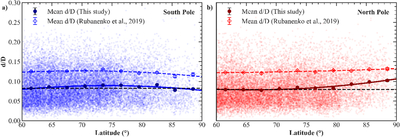
Caption: Figure 1.
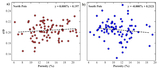
Depth-to-diameter ratio distribution of lunar polar craters with respect to latitude for the (a) south and (b) north poles. Individual craters are shown as faint points. Filled circles represent mean d/D values calculated in 3° latitude bins in this study, while open diamonds denote mean values reported by L. Rubanenko et al. (2019). Dashed horizontal lines indicate reference d/D values based on the mean at ∼62°N/S latitude. The error bars represent standard error in mean values.
Other Images in This Article
Show More
Copyright and Terms & Conditions
© 2026. The Author(s). Published by the American Astronomical Society.

Copyright ©
2026 Astronomy Image Explorer. All Rights Reserved.
