

Image Details
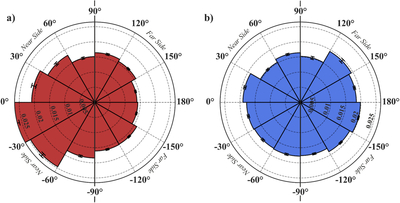
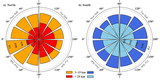
Caption: Figure 9.
Rose diagram showing variation in average rim curvature of 3–15 km diameter craters with longitude for the lunar north (red) and south (blue) polar regions. The inner dashed circles indicate mean curvature. Radial bar length represents the relative distribution of curvature values within each 30° longitude bin, and error bars indicate associated variability in mean.
Other Images in This Article
Show More
Copyright and Terms & Conditions
© 2026. The Author(s). Published by the American Astronomical Society.

Copyright ©
2026 Astronomy Image Explorer. All Rights Reserved.
