

Image Details
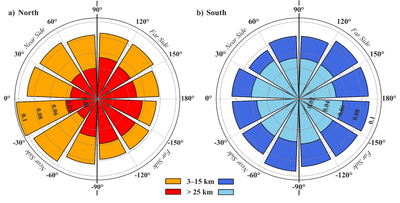
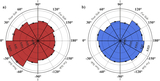
Caption: Figure 6.
Rose diagrams showing the longitudinal distribution of crater d/D at the lunar (a) north and (b) south poles. Craters are grouped into two diameter ranges, 3–15 km and ≥25 km, as indicated in the legends. The inner dashed circles indicate mean d/D. Radial bar length represents the relative contribution of d/D within each 30° longitude bin. The black vertical solid line separates the nearside and farside of the Moon.
Other Images in This Article
Show More
Copyright and Terms & Conditions
© 2026. The Author(s). Published by the American Astronomical Society.

Copyright ©
2026 Astronomy Image Explorer. All Rights Reserved.
