

Image Details
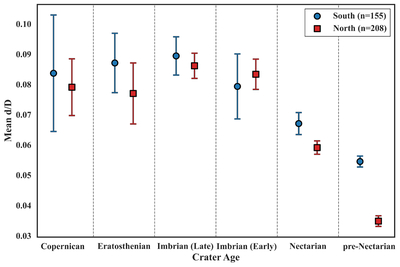
Caption: Figure 7.
Mean d/D of craters (≥25 km diameter) at the lunar north (red squares) and south (blue circles) polar regions plotted as a function of crater age. Error bars represent the associated variability in d/D within each age group. The crater data used for the statistics shown in this figure are available as data behind the figure.
(The data used to create this figure are available in the online article.)
(The data used to create this figure are available.)
Other Images in This Article
Show More
Copyright and Terms & Conditions
© 2026. The Author(s). Published by the American Astronomical Society.

Copyright ©
2026 Astronomy Image Explorer. All Rights Reserved.
