

Image Details
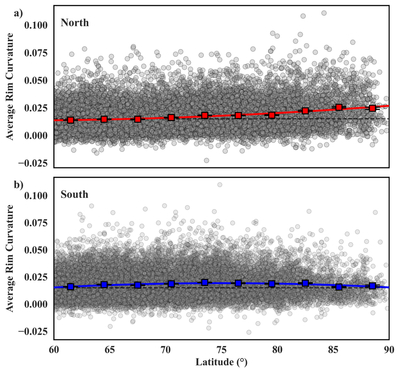
Caption: Figure 8.
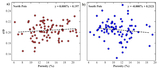
Scatter plots showing average rim curvature of 3–15 km diameter craters as a function of latitude for the lunar (a) north and (b) south polar regions. Gray circles represent individual craters, while colored squares denote mean curvature values at 3° latitude intervals. The solid colored lines illustrate the trend in mean rim curvature with latitude, and the dashed horizontal line serves as a reference. The error bars represent the standard error in mean values.
Other Images in This Article
Show More
Copyright and Terms & Conditions
© 2026. The Author(s). Published by the American Astronomical Society.

Copyright ©
2026 Astronomy Image Explorer. All Rights Reserved.
