

Image Details
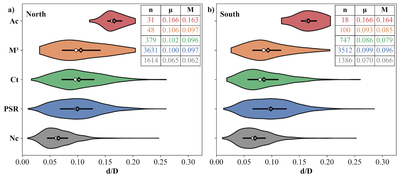
Caption: Figure 3.
Violin plots of the d/D distributions for the different crater populations in the (a) north and (b) south polar regions. Craters are classified as Nc (normal craters), PSRs, Ct (cold traps), M3 (craters associated with M3-based ice detections), and Ac (DFSAR anomalous craters). The width of each violin represents the probability density of d/D values. Black diamonds indicate the mean d/D for each population, white circles denote the median, and horizontal black bars represent the interquartile range. The number of samples (n), mean (μ), and median (M) for each crater class are provided in the inset table, color coded with respect to each crater class.
Other Images in This Article
Show More
Copyright and Terms & Conditions
© 2026. The Author(s). Published by the American Astronomical Society.

