Image Details
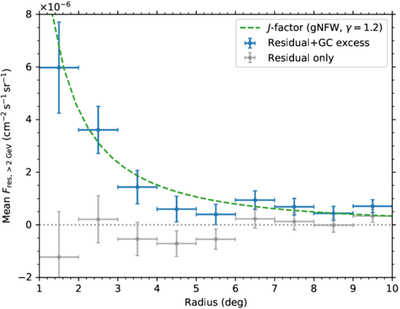
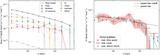
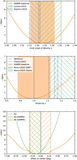
Caption: Figure 7.
The average residual flux in annuli centered at GC. The gray points show the residual flux given the alternative model, whereas the blue points show the flux that includes both the residual and GC excess. The green dashed line represents the flux of the best-fit J-factor model.
Other Images in This Article
Show More
Copyright and Terms & Conditions
© 2026. The Author(s). Published by the American Astronomical Society.
Copyright ©
2026 Astronomy Image Explorer. All Rights Reserved.