Image Details
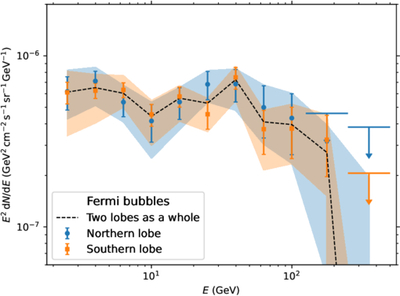
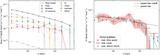
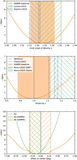
Caption: Figure 5.
The SEDs of the northern (blue) and southern (orange) lobes. The points show the baseline spectrum and the statistical uncertainties, whereas the bands give the total errors. The black dashed line is the best-fit SED of the whole bubbles.
Other Images in This Article
Show More
Copyright and Terms & Conditions
© 2026. The Author(s). Published by the American Astronomical Society.
Copyright ©
2026 Astronomy Image Explorer. All Rights Reserved.