Image Details
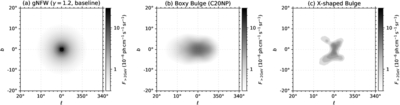
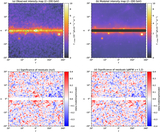
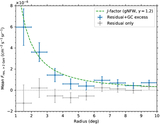
Caption: Figure 10.
Several spatial models for the GC excess: (a) the J-factor map given the gNFW profile with an inner slope of γ = 1.2, (b) a nonparametric bulge model (B. Coleman et al. 2020), and (c) an X-shaped bulge map (O. Macias et al. 2018; S. D. McDermott et al. 2023). The intensity of the each component is based on the best-fit model given the GC excess template. We do not convolve the maps with the PSF.
Other Images in This Article
Show More
Copyright and Terms & Conditions
© 2026. The Author(s). Published by the American Astronomical Society.
Copyright ©
2026 Astronomy Image Explorer. All Rights Reserved.