Image Details
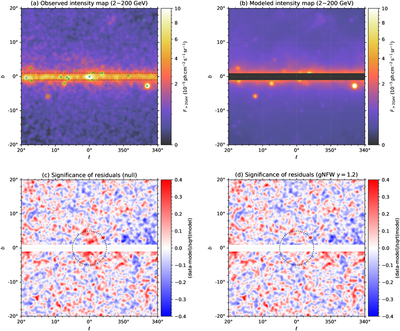
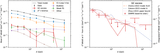
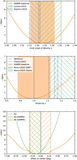
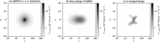
Caption: Figure 6.
Upper panels: integrated intensity map of the ROI from (a) the observations and (b) the best-fit null model. The green crosses represent the point sources in the DAMPE catalog. The black dashed line encloses the Galactic plane region (∣b∣ < 1∘) that is masked in the likelihood analysis. Lower panels: the significance of the residual maps for the model (c) without and (d) with the GC excess model. The black dotted line shows a 5∘ circle centered at the GC. All the maps are smoothed with a ﹩\sigma =0\mathop{.}\limits^{^\circ }3﹩ Gaussian kernel.
Other Images in This Article
Show More
Copyright and Terms & Conditions
© 2026. The Author(s). Published by the American Astronomical Society.
Copyright ©
2026 Astronomy Image Explorer. All Rights Reserved.