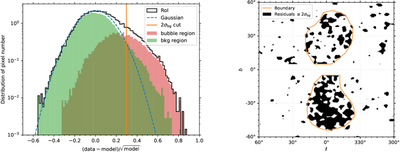
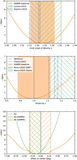
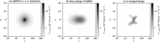
Image Details

Choose export citation format:

Observations of the Fermi Bubbles and the Galactic Center Excess with the Dark Matter Particle Explorer

  • Authors: F. Alemanno, Q. An, P. Azzarello, F. C. T. Barbato, P. Bernardini, X. J. Bi, H. V. Boutin, I. Cagnoli, M. S. Cai, E. Casilli, J. Chang, D. Y. Chen, J. L. Chen, Z. F. Chen, Z. X. Chen, P. Coppin, M. Y. Cui, T. S. Cui, I. De Mitri, F. de Palma, A. Di Giovanni, T. K. Dong, Z. X. Dong, G. Donvito, J. L. Duan, K. K. Duan, R. R. Fan, Y. Z. Fan, F. Fang, K. Fang, C. Q. Feng, L. Feng, S. Fogliacco, J. M. Frieden, P. Fusco, M. Gao, F. Gargano, E. Ghose, K. Gong, Y. Z. Gong, D. Y. Guo, J. H. Guo, S. X. Han, Y. M. Hu, G. S. Huang, X. Y. Huang, Y. Y. Huang, M. Ionica, L. Y. Jiang, W. Jiang, Y. Z. Jiang, J. Kong, A. Kotenko, D. Kyratzis, S. J. Lei, B. Li, M. B. Li, W. H. Li, W. L. Li, X. Li, X. Q. Li, Y. M. Liang, C. M. Liu, H. Liu, J. Liu, S. B. Liu, Y. Liu, F. Loparco, M. Ma, P. X. Ma, T. Ma, X. Y. Ma, G. Marsella, M. N. Mazziotta, D. Mo, Y. Nie, X. Y. Niu, A. Parenti, W. X. Peng, X. Y. Peng, C. Perrina, E. Putti- Garcia, R. Qiao, J. N. Rao, Y. Rong, R. Sarkar, P. Savina, A. Serpolla, Z. Shangguan, W. H. Shen, Z. Q. Shen, Z. T. Shen, L. Silveri, J. X. Song, H. Su, M. Su, H. R. Sun, Z. Y. Sun, A. Surdo, X. J. Teng, A. Tykhonov, G. F. Wang, J. Z. Wang, L. G. Wang, S. Wang, X. L. Wang, Y. F. Wang, D. M. Wei, J. J. Wei, Y. F. Wei, D. Wu, J. Wu, S. S. Wu, X. Wu, Z. Q. Xia, Z. Xiong, E. H. Xu, H. T. Xu, J. Xu, Z. H. Xu, Z. L. Xu, Z. Z. Xu, G. F. Xue, M. Y. Yan, H. B. Yang, P. Yang, Y. Q. Yang, H. J. Yao, Y. H. Yu, Q. Yuan, C. Yue, J. J. Zang, S. X. Zhang, W. Z. Zhang, Yan Zhang, Yi Zhang, Y. J. Zhang, Y. L. Zhang, Y. P. Zhang, Y. Q. Zhang, Z. Zhang, Z. Y. Zhang, C. Zhao, H. Y. Zhao, X. F. Zhao, C. Y. Zhou, X. Zhu, Y. Zhu

F. Alemanno et al 2026 The Astrophysical Journal Supplement Series 284 .

  • Provider: AAS Journals

Caption: Figure 2.

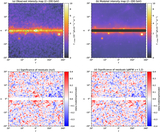
Left panel: distribution of the values in the significance map. The map, in HEALPix projection, is smoothed with a 1 Gaussian kernel. The black histogram shows the distribution of pixel numbers within the ROI, whereas the red and green ones show those within and outside the bubbles, respectively. The blue dashed line is a Gaussian profile with a mean value of zero fitted to the background histogram. The orange solid line represents the 2σbg cut adopted to define the bubbles’ boundary. Right panel: map with significance larger than the 2σbg cut. The bubble template in this work consists of two polygons whose boundaries are illustrated with the solid orange lines.

Other Images in This Article

Show More

Copyright and Terms & Conditions

Additional terms of reuse