Image Details
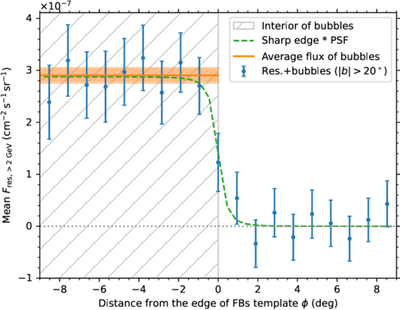
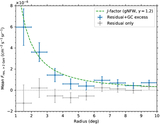
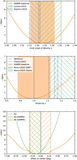
Caption: Figure 3.
The average residual flux as a function of angular distance to the edge in the high-latitude region with ∣b∣ > 20∘ (blue points). The residuals are obtained by extracting the best-fit model except for the bubbles from the data. The negative (positive) x-axis values represent the region inside (outside) the bubbles. The green dashed line is the sharp edge convolved with the PSF. The orange band is the average flux of the bubble template as a whole.
Other Images in This Article
Show More
Copyright and Terms & Conditions
© 2026. The Author(s). Published by the American Astronomical Society.
Copyright ©
2026 Astronomy Image Explorer. All Rights Reserved.