Image Details
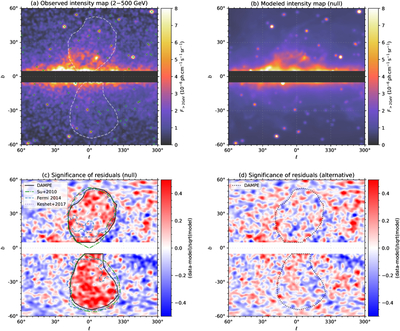
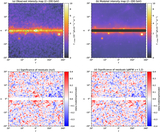
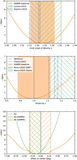
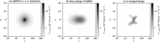
Caption: Figure 1.
Upper panels: intensity map from 2 to 500 GeV in the CAR projection, smoothed with a Gaussian kernel with ﹩\sigma =0\mathop{.}\limits^{^\circ }75﹩ for (a) the observed data and (b) best-fit model without the bubbles. The Galactic plane region (∣b∣ ≤ 5∘) is masked. The green crosses mark the point sources in the DAMPE catalog, whereas the gray contour encloses the Fermi bubbles. Lower panels: the significance of the residual maps smoothed with a 1∘ Gaussian kernel for the models (c) without and (d) with the bubbles. The black curve shows the boundary derived in this work, while the other lines represent the ones from Fermi-LAT.
Other Images in This Article
Show More
Copyright and Terms & Conditions
© 2026. The Author(s). Published by the American Astronomical Society.