Image Details
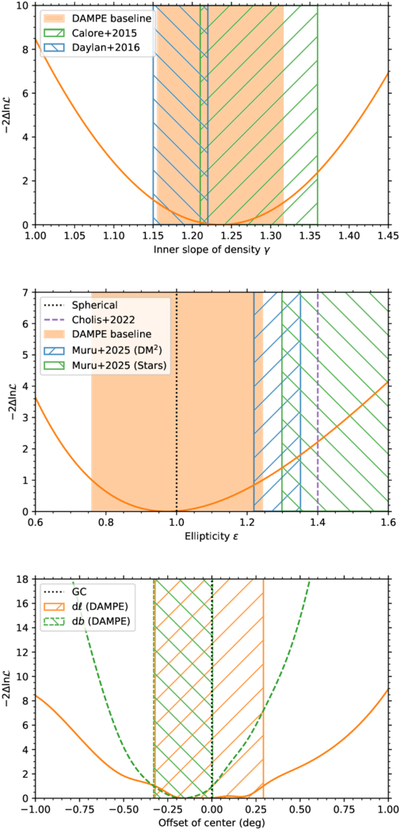
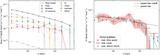
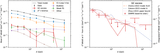
Caption: Figure 9.
The change of log-likelihood value as a function of the steepness (upper), the ellipticity (middle), and the center position (lower) of the DM density profile derived with the 2−20 GeV data assuming the baseline background model. In the lower panel, the orange solid and green dashed lines show the likelihood variation vs. Galactic longitude and latitude, respectively.
Other Images in This Article
Show More
Copyright and Terms & Conditions
© 2026. The Author(s). Published by the American Astronomical Society.
Copyright ©
2026 Astronomy Image Explorer. All Rights Reserved.