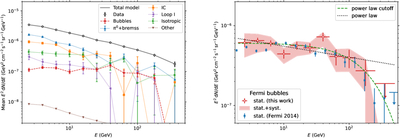
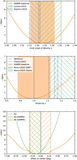
Image Details

Choose export citation format:

Observations of the Fermi Bubbles and the Galactic Center Excess with the Dark Matter Particle Explorer

  • Authors: F. Alemanno, Q. An, P. Azzarello, F. C. T. Barbato, P. Bernardini, X. J. Bi, H. V. Boutin, I. Cagnoli, M. S. Cai, E. Casilli, J. Chang, D. Y. Chen, J. L. Chen, Z. F. Chen, Z. X. Chen, P. Coppin, M. Y. Cui, T. S. Cui, I. De Mitri, F. de Palma, A. Di Giovanni, T. K. Dong, Z. X. Dong, G. Donvito, J. L. Duan, K. K. Duan, R. R. Fan, Y. Z. Fan, F. Fang, K. Fang, C. Q. Feng, L. Feng, S. Fogliacco, J. M. Frieden, P. Fusco, M. Gao, F. Gargano, E. Ghose, K. Gong, Y. Z. Gong, D. Y. Guo, J. H. Guo, S. X. Han, Y. M. Hu, G. S. Huang, X. Y. Huang, Y. Y. Huang, M. Ionica, L. Y. Jiang, W. Jiang, Y. Z. Jiang, J. Kong, A. Kotenko, D. Kyratzis, S. J. Lei, B. Li, M. B. Li, W. H. Li, W. L. Li, X. Li, X. Q. Li, Y. M. Liang, C. M. Liu, H. Liu, J. Liu, S. B. Liu, Y. Liu, F. Loparco, M. Ma, P. X. Ma, T. Ma, X. Y. Ma, G. Marsella, M. N. Mazziotta, D. Mo, Y. Nie, X. Y. Niu, A. Parenti, W. X. Peng, X. Y. Peng, C. Perrina, E. Putti- Garcia, R. Qiao, J. N. Rao, Y. Rong, R. Sarkar, P. Savina, A. Serpolla, Z. Shangguan, W. H. Shen, Z. Q. Shen, Z. T. Shen, L. Silveri, J. X. Song, H. Su, M. Su, H. R. Sun, Z. Y. Sun, A. Surdo, X. J. Teng, A. Tykhonov, G. F. Wang, J. Z. Wang, L. G. Wang, S. Wang, X. L. Wang, Y. F. Wang, D. M. Wei, J. J. Wei, Y. F. Wei, D. Wu, J. Wu, S. S. Wu, X. Wu, Z. Q. Xia, Z. Xiong, E. H. Xu, H. T. Xu, J. Xu, Z. H. Xu, Z. L. Xu, Z. Z. Xu, G. F. Xue, M. Y. Yan, H. B. Yang, P. Yang, Y. Q. Yang, H. J. Yao, Y. H. Yu, Q. Yuan, C. Yue, J. J. Zang, S. X. Zhang, W. Z. Zhang, Yan Zhang, Yi Zhang, Y. J. Zhang, Y. L. Zhang, Y. P. Zhang, Y. Q. Zhang, Z. Zhang, Z. Y. Zhang, C. Zhao, H. Y. Zhao, X. F. Zhao, C. Y. Zhou, X. Zhu, Y. Zhu

F. Alemanno et al 2026 The Astrophysical Journal Supplement Series 284 .

  • Provider: AAS Journals

Caption: Figure 4.

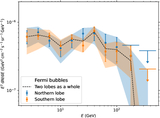
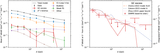
Left panel: the average fluxes of the observed data (black hollow points) and various fitted components in the baseline model (solid points connected with lines) within the ROI. The red points show the flux of the bubbles. The masked Galactic plane and point sources are excluded from the calculation. Right panel: the SED of the Fermi bubbles. The red points show the best-fit SED from DAMPE given the baseline model, whereas the blue points show those from Fermi-LAT (M. Ackermann et al. 2014). A 95% upper limit is given when the TS value is below nine. The red band exhibits the total errors from the statistical and systematic uncertainties. The optimal single PL model and PL cutoff model are also presented with black dotted and green dashed lines, respectively.

Other Images in This Article

Show More

Copyright and Terms & Conditions

Additional terms of reuse