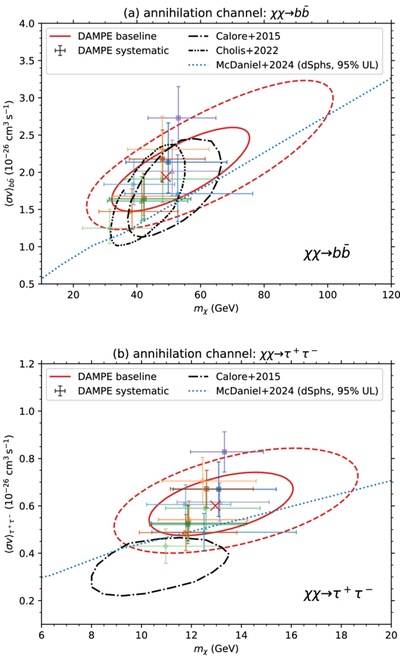
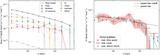
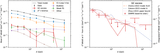
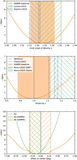
Image Details

Choose export citation format:

Observations of the Fermi Bubbles and the Galactic Center Excess with the Dark Matter Particle Explorer

  • Authors: F. Alemanno, Q. An, P. Azzarello, F. C. T. Barbato, P. Bernardini, X. J. Bi, H. V. Boutin, I. Cagnoli, M. S. Cai, E. Casilli, J. Chang, D. Y. Chen, J. L. Chen, Z. F. Chen, Z. X. Chen, P. Coppin, M. Y. Cui, T. S. Cui, I. De Mitri, F. de Palma, A. Di Giovanni, T. K. Dong, Z. X. Dong, G. Donvito, J. L. Duan, K. K. Duan, R. R. Fan, Y. Z. Fan, F. Fang, K. Fang, C. Q. Feng, L. Feng, S. Fogliacco, J. M. Frieden, P. Fusco, M. Gao, F. Gargano, E. Ghose, K. Gong, Y. Z. Gong, D. Y. Guo, J. H. Guo, S. X. Han, Y. M. Hu, G. S. Huang, X. Y. Huang, Y. Y. Huang, M. Ionica, L. Y. Jiang, W. Jiang, Y. Z. Jiang, J. Kong, A. Kotenko, D. Kyratzis, S. J. Lei, B. Li, M. B. Li, W. H. Li, W. L. Li, X. Li, X. Q. Li, Y. M. Liang, C. M. Liu, H. Liu, J. Liu, S. B. Liu, Y. Liu, F. Loparco, M. Ma, P. X. Ma, T. Ma, X. Y. Ma, G. Marsella, M. N. Mazziotta, D. Mo, Y. Nie, X. Y. Niu, A. Parenti, W. X. Peng, X. Y. Peng, C. Perrina, E. Putti- Garcia, R. Qiao, J. N. Rao, Y. Rong, R. Sarkar, P. Savina, A. Serpolla, Z. Shangguan, W. H. Shen, Z. Q. Shen, Z. T. Shen, L. Silveri, J. X. Song, H. Su, M. Su, H. R. Sun, Z. Y. Sun, A. Surdo, X. J. Teng, A. Tykhonov, G. F. Wang, J. Z. Wang, L. G. Wang, S. Wang, X. L. Wang, Y. F. Wang, D. M. Wei, J. J. Wei, Y. F. Wei, D. Wu, J. Wu, S. S. Wu, X. Wu, Z. Q. Xia, Z. Xiong, E. H. Xu, H. T. Xu, J. Xu, Z. H. Xu, Z. L. Xu, Z. Z. Xu, G. F. Xue, M. Y. Yan, H. B. Yang, P. Yang, Y. Q. Yang, H. J. Yao, Y. H. Yu, Q. Yuan, C. Yue, J. J. Zang, S. X. Zhang, W. Z. Zhang, Yan Zhang, Yi Zhang, Y. J. Zhang, Y. L. Zhang, Y. P. Zhang, Y. Q. Zhang, Z. Zhang, Z. Y. Zhang, C. Zhao, H. Y. Zhao, X. F. Zhao, C. Y. Zhou, X. Zhu, Y. Zhu

F. Alemanno et al 2026 The Astrophysical Journal Supplement Series 284 .

  • Provider: AAS Journals

Caption: Figure 14.

The preferred DM parameters for the annihilation channels of (a) ﹩\chi \chi \to b\bar{b}﹩ and (b) χχ → τ+τ. The red crosses are the best-fit points. The solid and dashed red contours are the 1σ and 2σ regions, respectively. The error bars show the DM parameters and the statistical uncertainties, given various background models with the same colors as those in Figure 11. The dotted–dashed and dotted lines are the 2σ contours from the Fermi-LAT observations of the GC excess. The blue dotted lines are the 95% confidence level upper limits from dSphs observed by Fermi-LAT.

Other Images in This Article

Show More

Copyright and Terms & Conditions

Additional terms of reuse