Image Details
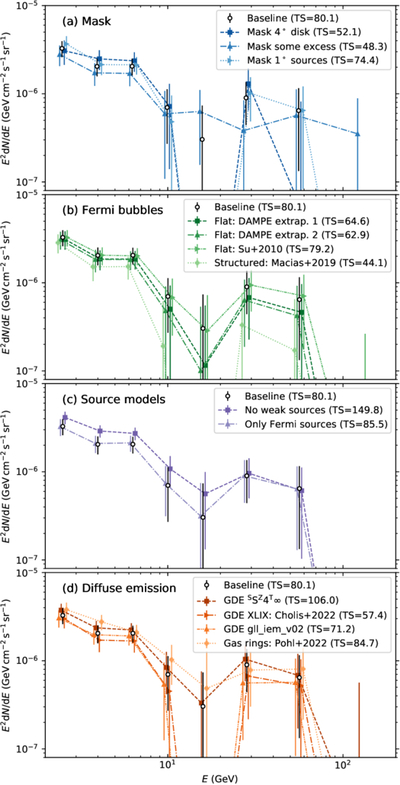
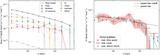
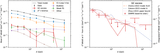
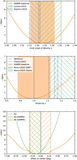
Caption: Figure 11.
The systematic uncertainty of the GC excess caused by the analysis procedures and the background models, including (a) the mask, (b) the Fermi bubbles template, (c) the point and extended sources, and (d) the GDE models. The points show the SEDs and the statistical uncertainties measured at 5∘ from the GC. The TS values in the labels are for the 2−200 GeV data. The central energies are slightly offset to avoid overlapping.
Other Images in This Article
Show More
Copyright and Terms & Conditions
© 2026. The Author(s). Published by the American Astronomical Society.
Copyright ©
2026 Astronomy Image Explorer. All Rights Reserved.