Image Details
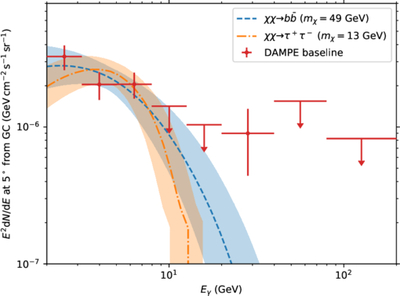
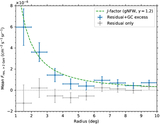
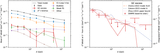
Caption: Figure 13.
The SED of the GC excess (red points) for the baseline background and the best-fit DM annihilation models. The blue dashed and orange dotted–dashed lines correspond to the DM annihilation channels of ﹩\chi \chi \to b\bar{b}﹩ and χχ → τ+τ−, respectively. The colored bands show the 1σ statistical uncertainties of the DM models.
Other Images in This Article
Show More
Copyright and Terms & Conditions
© 2026. The Author(s). Published by the American Astronomical Society.
Copyright ©
2026 Astronomy Image Explorer. All Rights Reserved.