

Image Details
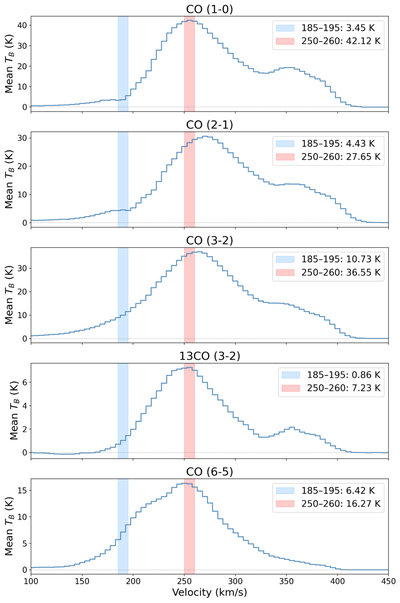
Caption: Figure 9.
Representative spectra for each CO transition within the bubble aperture, constructed by taking the mean brightness temperature at each velocity over all pixels within the aperture. The red shaded regions (250–260 km s−1) indicate the velocity interval used to extract the representative line intensities for the primary non-LTE analysis, corresponding to the peak of the molecular emission. The blue shaded regions (185–195 km s−1) indicate the velocity interval used for the second non-LTE analysis, corresponding to the lower-velocity emission associated with the expanding shell (Figure 4). The secondary component is most clearly distinguished in the CO(1–0) and CO(2–1) spectra.
Other Images in This Article
Show More
Copyright and Terms & Conditions
© 2026. The Author(s). Published by the American Astronomical Society.

