

Image Details
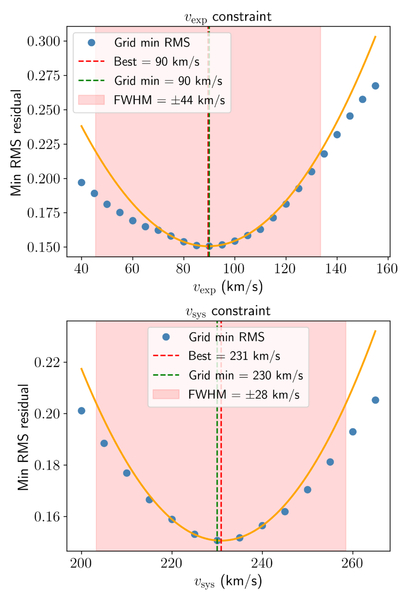
Caption: Figure 7.
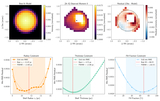
Marginal rms residual profiles for the expansion velocity ﹩{v}_{{\rm{\exp }}}﹩ (top) and systemic velocity (bottom), with the parabolic fit (solid yellow curve), best-fit value (red-dashed vertical line), grid minimum (green-dashed vertical line), and 1σ uncertainty range (shaded) indicated on each panel.
Other Images in This Article
Show More
Copyright and Terms & Conditions
© 2026. The Author(s). Published by the American Astronomical Society.

Copyright ©
2026 Astronomy Image Explorer. All Rights Reserved.
