

Image Details
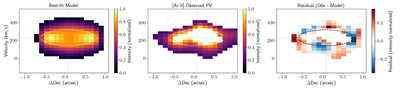
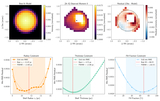
Caption: Figure 6.
Forward modeling kinematic fit to the [Ar II] PV diagram. The best-fit model PV diagram (left), observed [Ar II] PV diagram (center), and pixel-by-pixel residual map (right) are all flux-normalized. The best-fit dashed ellipse, with semi-axes r0 and ﹩{v}_{{\rm{\exp }}}﹩ centered on vsys, is overplotted on each panel. The residual is shown on a scale where red (blue) indicates regions where the observations exceed (falls below) the model.
Other Images in This Article
Show More
Copyright and Terms & Conditions
© 2026. The Author(s). Published by the American Astronomical Society.

Copyright ©
2026 Astronomy Image Explorer. All Rights Reserved.
