

Image Details
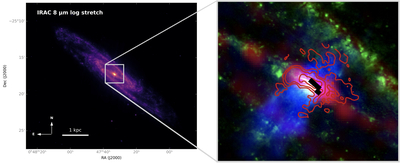
Caption: Figure 1.
Overview of the multiphase outflow in NGC 253. Left: Spitzer IRAC 8 μm image from the Local Volume Legacy survey, shown with a logarithmic stretch (D. A. Dale et al. 2009; J. C. Lee et al. 2009). The white box marks the central region shown in the right panel, and the scale bar corresponds to 1 kpc. Right: composite view of the nuclear starburst region highlighting the base of the large-scale superwind. The background three-color image is adapted from S. Lopez et al. (2023), where blue shows broadband (0.5–7 keV) X-ray emission, green shows Hα emission (M. D. Lehnert & T. M. Heckman 1996), and red shows CO(2–1) emission (A. K. Leroy et al. 2021). Red contours indicate the molecular outflow detected in CO (A. D. Bolatto et al. 2013). The JWST footprint for observations presented in this paper is overlaid in solid black.
Other Images in This Article
Show More
Copyright and Terms & Conditions
© 2026. The Author(s). Published by the American Astronomical Society.

