

Image Details
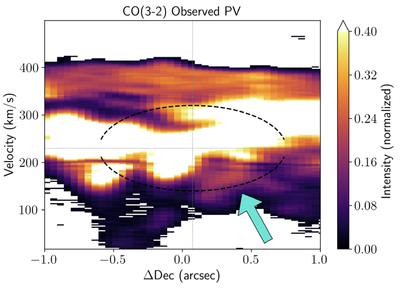
Caption: Figure 8.
Observed CO(3–2) PV diagram extracted along the north–south direction through the bubble center, with the best-fit [Ar II] ellipse (dashed) overlaid for reference. The cyan arrow marks faint emission at lower velocities (∼100 km s−1) offset to the south, which we associate with the swept-up shell. A bright, spectrally broad component dominates at velocities ≳200 km s−1, likely unrelated foreground molecular emission. For this reason, we saturate (in white) the brightest emission in the PV diagram.
Other Images in This Article
Show More
Copyright and Terms & Conditions
© 2026. The Author(s). Published by the American Astronomical Society.

Copyright ©
2026 Astronomy Image Explorer. All Rights Reserved.
