

Image Details
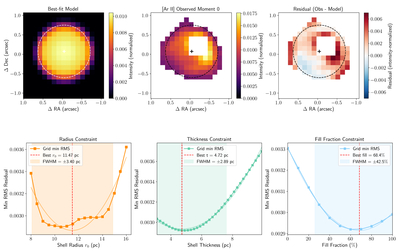
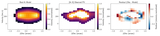
Caption: Figure 5.
Top row: forward modeling morphological fit to the [Ar II] moment 0 map. The best-fit model moment 0 map (left), observed [Ar II] moment 0 map (center), and pixel-by-pixel residual map (right) are all flux-normalized. The dashed circle marks the best-fit shell radius r0, and the cross marks the best-fit center offset. The residual is shown on a scale where red (blue) indicates regions where the observation exceeds (falls below) the model. Bottom row: marginal rms residual profiles for the shell radius r0 (left), shell thickness Δr (center), and the fill fraction f (right) with the parabolic fit (solid curve), best-fit value (red-dashed vertical line), and 1σ uncertainty range (shaded) indicated on each panel.
Other Images in This Article
Show More
Copyright and Terms & Conditions
© 2026. The Author(s). Published by the American Astronomical Society.

