

Image Details
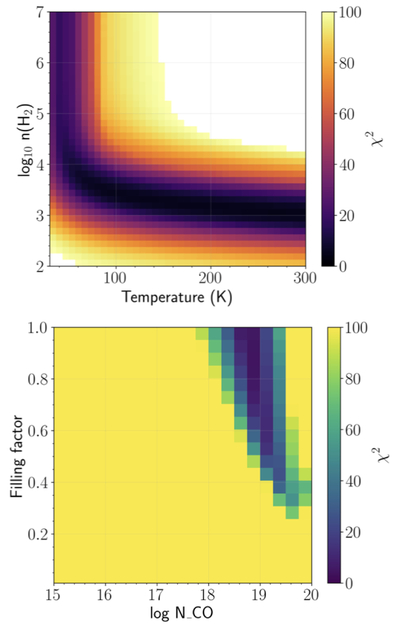
Caption: Figure 10.
Reduced χ2 maps from the RADEX modeling using integrated intensities measured over the full CO emission profile. The top panel shows the minimum reduced χ2 as a function of kinetic temperature and H2 density. The modeling constrains the gas density to n(H2) ≳ 103 cm−3, while the kinetic temperature remains largely unconstrained over the explore range. The bottom panel shows the minimum reduced χ2 as a function of CO column density and beam filling factor. A well-defined minimum is found at NCO ≈ 8.9 × 1018 cm−2, with the elongated valley reflecting the degeneracy between CO column density and filling factor.
Other Images in This Article
Show More
Copyright and Terms & Conditions
© 2026. The Author(s). Published by the American Astronomical Society.

