

Image Details
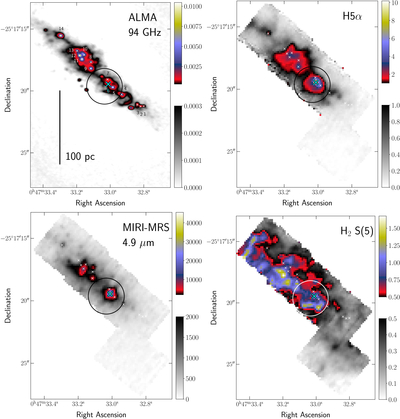
Caption: Figure 2.
Top left: ALMA Band 3 continuum image from E. A. C. Mills et al. (2021), tracing a mix of free–free continuum emission from ionized gas, dust thermal emission from compact gas clouds, and synchrotron emission from supernova remnants. Top right: continuum-subtracted and integrated emission from the H5α line tracing ionized gas with units of 106 MJy sr−1 km s−1. Bottom left: MIRI-MRS continuum image of the central starburst of NGC 253 at 4.9 μm, primarily showing stellar emission, with units in MJy sr−1. Bottom right: continuum-subtracted and integrated emission from the H2 S(5) line tracing warm molecular gas with units of 106 MJy sr−1 km s−1. Cluster positions from E. A. C. Mills et al. (2021) for the 14 clusters identified from A. K. Leroy et al. (2018) are plotted as white x-shaped points and numbered in the top left panel. The position of SSC 6 is shown as an oversized cyan x. The circle indicates the region that is further extracted for analysis in this work.
Other Images in This Article
Show More
Copyright and Terms & Conditions
© 2026. The Author(s). Published by the American Astronomical Society.

