

Image Details
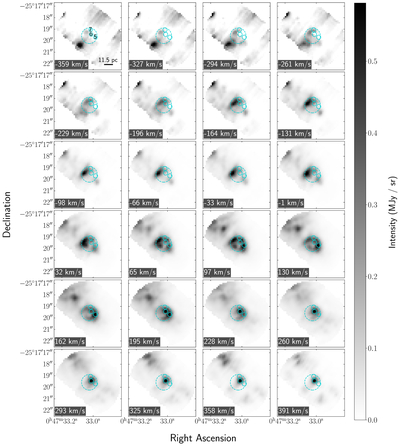
Caption: Figure 3.
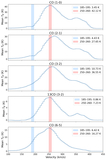
[Ar II] (7.0 μm) emission line channel maps with units of MJy sr−1 and velocity range (−359, +391) km s−1. The larger dashed cyan circle represents the approximate extent of the bubble emission. A scale bar of 11.5 pc (bubble radius) is given in the first panel. The smaller solid cyan circles are the central positions of SSC 5, 6, and 7, numbered in the first panel. This extracted region is defined in Figure 2.
Other Images in This Article
Show More
Copyright and Terms & Conditions
© 2026. The Author(s). Published by the American Astronomical Society.

Copyright ©
2026 Astronomy Image Explorer. All Rights Reserved.
