

Image Details
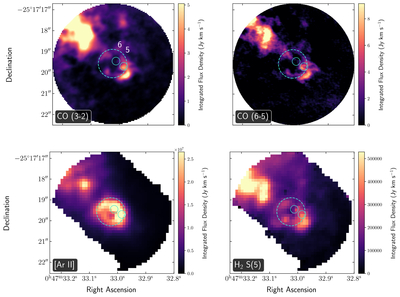
Caption: Figure 4.
Restricted-velocity (25–198 km s−1) moment 0 maps for selected ionized and molecular tracers in units of Jy km s−1. The velocity range was chosen to isolate the bubble-associated emission from other bright features present in the spectrum. All maps are labeled in the bottom left corner. The location and size of the bubble is shown with the dashed cyan circle (see Table 3). The solid cyan circles are the central positions of SSC 5 and 6, numbered in the first panel.
Other Images in This Article
Show More
Copyright and Terms & Conditions
© 2026. The Author(s). Published by the American Astronomical Society.

Copyright ©
2026 Astronomy Image Explorer. All Rights Reserved.
