Image Details
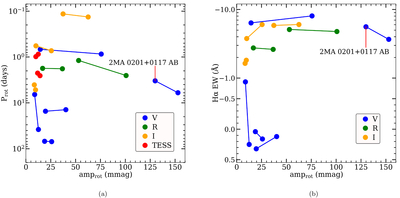
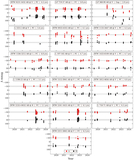
Caption: Figure 15.
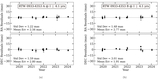
Peak-to-peak rotation photometric amplitudes (amprot) compared with rotation periods in panel (a) and with mean Hα EWs in panel (b) for twin stars from our Results Sample, with lines connecting the components in each binary. Values are from Table 3, Table 6, and C25, with most systems shown here being FC cases. We do not show the range of observed Hα EWs in panel (b) for visual clarity, and only use nonflaring CHIRON epochs with both stars observed back to back. The y-axes are set such that a star with more emission or more rapid rotation moves upward in each plot. Points are color coded by their respective observation filters, which is important considering photometric variability amplitudes will generally appear larger in bluer filters (A. D. Hosey et al. 2015; A. Kar et al. 2024). We include LP 368–99 AB under “R” given the similarity between R and the ZTF zr filter actually used for its amplitude measurements. RTW 0409+4623 AB and RTW 2202+5537 AB are handled as described in Figure 13. The pair with the largest photometric amplitudes is the pre-main-sequence (PMS) system 2MA 0201+0117 AB described in C25. Stars with the largest amplitudes are generally more likely to be active in Hα and relatively rapidly rotating, as expected.
Other Images in This Article
Show More
Copyright and Terms & Conditions
© 2026. The Author(s). Published by the American Astronomical Society.