Image Details
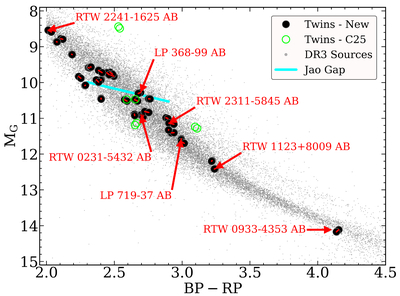
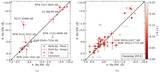
Caption: Figure 1.
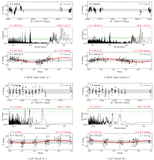
An observational Hertzsprung–Russell diagram (HRD) of our Full Sample using Gaia DR3 values. The 64 components comprising 32 pairs in this paper’s New Systems are shown as black circles, with red lines connecting the components in each pair. Open green circles indicate the remaining four systems (eight components) previously discussed in our first paper in this series (A. A. Couperus et al. 2025, C25). The main sequence is illustrated with gray points using a sample of Gaia DR3 sources within 50 pc. A diagonal cyan line shows the Jao Gap near 0.35 M⊙ (W.-C. Jao et al. 2018, 2023), indicating the transition region for partially convective stars above it and fully convective stars below it. We visually offset the gap upper edge definition from W.-C. Jao et al. (2023) downward by 0.05 mag to better align with the center of the gap region. Various systems discussed throughout this paper are individually identified with red arrows and labels.
Other Images in This Article
Show More
Copyright and Terms & Conditions
© 2026. The Author(s). Published by the American Astronomical Society.