Image Details
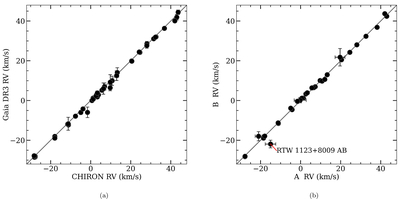
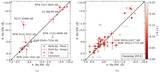
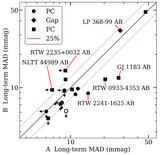
Caption: Figure 3.
Two equivalency plots assessing radial velocity measurements for the stars in our Results Sample. Gray one-to-one lines are underplotted. Error bars are always shown but often appear smaller than the points. Panel (a): a comparison of our CHIRON RVs (Table 3 and C25) and the Gaia DR3 RVs (Table 1) for the 43 individual stars with both measures available, using the weighted mean RVs for cases with multiple CHIRON epochs. Panel (b): the RVs of our A and B components are compared for each system, except RTW 2202+5537 AB as B lacks an RV measure. We use CHIRON RVs if available, employing weighted mean RVs for cases with multiple epochs, and otherwise use Gaia DR3 RVs. Both panels demonstrate consistent agreement between the various measures, supporting the binary nature of our targets.
Other Images in This Article
Show More
Copyright and Terms & Conditions
© 2026. The Author(s). Published by the American Astronomical Society.