Image Details
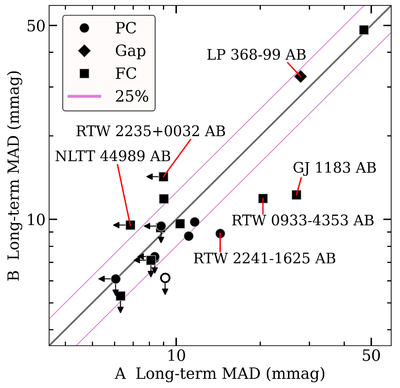
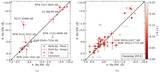
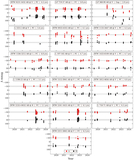
Caption: Figure 9.
A comparison is given of the 0.9 m long-term photometric variability levels between twin pair components from our Results Sample, using values from Table 5 and C25. A one-to-one line and corresponding 25% (1.25×) bounding lines are shown. Point shapes correspond to the stars’ interior structures as specified in the legend. A star with an MAD variability measure less than or within 10% of its reference field MAD noise level is considered not varying beyond the noise and shows a corresponding upper-limit arrow. The single open circle indicates the system RTW 1133–3447 AB, where the A component’s variability measure is unreliable owing to a contaminating diffraction spike. Several key systems discussed throughout the text are labeled. While sometimes limited in baseline, cadence, and/or precision, these results begin to probe the predictability of long-term multiyear photometric variability in twin M dwarfs.
Other Images in This Article
Show More
Copyright and Terms & Conditions
© 2026. The Author(s). Published by the American Astronomical Society.