Image Details
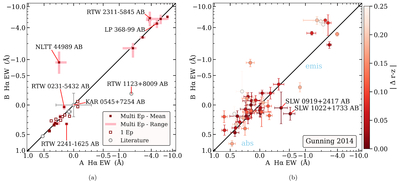
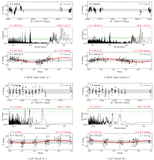
Caption: Figure 6.
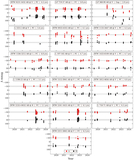
Hα EWs are compared between M dwarf binary components for two samples of twin or nearly twin systems. Each plot is scaled linearly between −0.5 and +0.5 and logarithmically outside these bounds. Several systems discussed throughout the text are labeled. Panel (a): the left panel shows our Results Sample, using measurements reported in Table 3 and C25. Cases with multiple CHIRON epochs show their observed ranges of Hα EWs as shaded bars, while those with only a single CHIRON epoch have un-shown measurement uncertainties that are typically smaller than the points. The CHIRON Hα results shown here only include epochs with both stars successfully observed back to back and with neither flaring. Panel (b): a sample of 48 nearly twin M dwarf wide binaries from H. C. Gunning et al. (2014) is reproduced in the right panel using data from their Table 1, with their EWs inverted in sign to match our convention of negative values indicating emission. Their five systems with multiple epochs use the mean and standard deviation of observed activity. Points are color coded by the absolute difference in r − z color between stars in a system, with more twin-like pairs having darker colors. Both panels show many well-matched systems alongside several key outliers hosting large activity mismatches. See Section 6.3 for further discussion.
Other Images in This Article
Show More
Copyright and Terms & Conditions
© 2026. The Author(s). Published by the American Astronomical Society.