Image Details
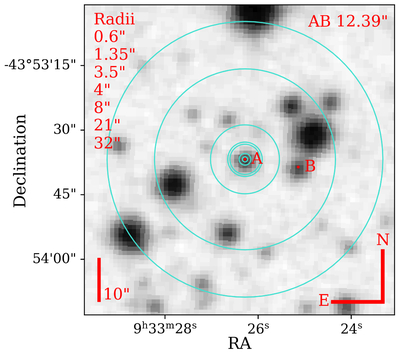
Caption: Figure 2.
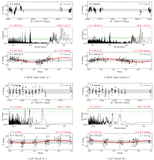
An example archival image from the DSS2-Red survey (B. M. Lasker et al. 1996; R. R. Gal et al. 2004) showing our twin stars RTW 0933–4353 A and B separated by 12″, with A and B shifted by their Gaia DR3 proper motions to 1998.0 for alignment with the image. In order of their listed increasing radii, the blue circles correspond to: (1) the typical 1﹩\mathop{.}\limits^{^{\prime\prime} }﹩2 seeing at CTIO for our SMARTS 0.9 m and 1.5 m observations, (2) the 2﹩\mathop{.}\limits^{^{\prime\prime} }﹩7 diameter CHIRON spectral fiber, (3) the 3﹩\mathop{.}\limits^{^{\prime\prime} }﹩5 Gaia BP and RP measurement region, (4) the 4″ minimum separation of our AB pairs and rough boundary for blending sources in our 0.9 m observations depending on the seeing, (5) the 8″ boundary near which sources begin to blend in ZTF, (6) a single 21″ TESS pixel while keeping in mind that a common TESS aperture is a 3 × 3 pixel grid, and (7) the 32″ boundary at which sources begin to blend in ASAS-SN data. All of our analyses and results here consider the variety of possible AB blending and background contamination impacts, as detailed in Sections 4 and 8.2.
Other Images in This Article
Show More
Copyright and Terms & Conditions
© 2026. The Author(s). Published by the American Astronomical Society.