Image Details
Caption: Figure 8.
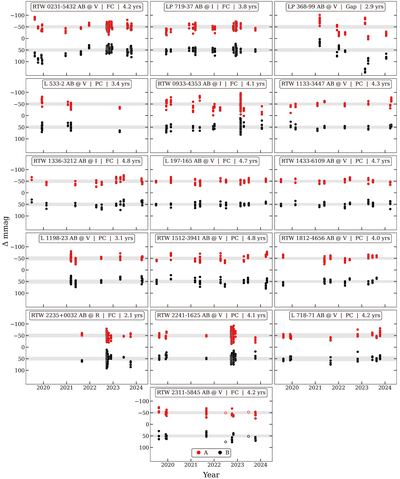
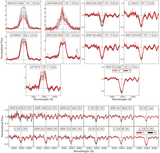
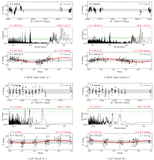
Differential light curves from the 0.9 m long-term program for 16 of our observed New Systems, ordered by ascending R.A., with known or suspected non-twin higher-order multiples excluded. A (red) and B (black) components are compared in each subplot, offset by −50 mmag for A and +50 mmag for B. Times are 2000 plus the number of Julian years since J2000. Gray shaded regions show the average noise of the nonvarying reference stars in each field, spanning above and below each component’s mean magnitude; typical noise levels are 5–10 mmag. Insets specify the filter, structure, and data time span. Corresponding long-term variability and noise measurements are given in Table 5. The large clusters of points for some stars are high-cadence rotation observations discussed in Section 8, while open circles indicate visits with only one usable frame. Strong variations in LP 368–99 A and B are likely due to rotation, while RTW 1133–3447 A is contaminated by a nearby diffraction spike. These light-curve data are available as Data behind the Figure (DbF) products.
(The data used to create this figure are available in the online article.)
(The data used to create this figure are available.)
Other Images in This Article
Show More
Copyright and Terms & Conditions
© 2026. The Author(s). Published by the American Astronomical Society.