Image Details
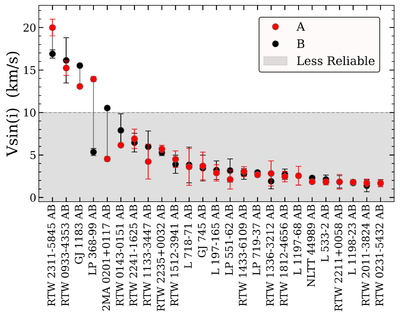
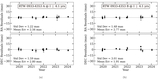
Caption: Figure 4.
Our CHIRON ﹩v\,\sin (i)﹩ values compared between twin pair components from our Results Sample, using the measurements from Table 3 and C25 and plotting error bars in all cases. Systems are ordered by descending ﹩v\,\sin (i)﹩ value, with vertical gray lines connecting the component stars, and a gray shaded region indicating less-reliable measures at <10 km s−1. The three systems with both stars above 10 km s−1 show broadly similar values between components, while the remaining majority of systems also typically show well-aligned values despite residing in the region of less-reliable measurements. The handful of exceptions are discussed in Section 6.2 and align with their observed component rotation periods.
Other Images in This Article
Show More
Copyright and Terms & Conditions
© 2026. The Author(s). Published by the American Astronomical Society.