Image Details
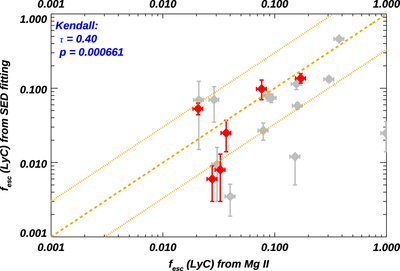
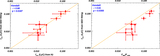
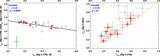
Caption: Figure 13.
Comparisons of measured ﹩{f}_{\mathrm{esc}}^{\mathrm{LyC}}﹩ with the predicted one from Mg II λ2796 emission lines and dust extinction (Section 4.5). Galaxies from our Mg II selected sample are shown with red diamonds, while galaxies from comparison samples with high-S/N Mg II detections (Izotov et al. 2016a, 2018a, 2018b; Guseva et al. 2020; Izotov et al. 2021; LzLCS) are shown with gray diamonds. We show where y = x as the dashed orange lines and where y = 1/3x and 3x as the dotted orange lines. There is a positive 1:1 correlation, and the RMSE is ∼0.05. See discussion in Section 4.5.
Other Images in This Article
Show More
Copyright and Terms & Conditions
© 2022. The Author(s). Published by the American Astronomical Society.