Image Details
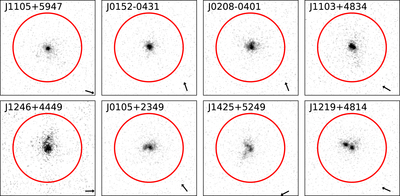
Caption: Figure 1.
The HST/COS NUV acquisition images for galaxies in our sample. For each panel, we overlay the COS aperture with a diameter of 2.″5 as the red circle and denote the spectral dispersion axis by the black arrow. Objects are ordered by the measured escape fraction of Lyman continuum (﹩{f}_{\mathrm{esc}}^{\mathrm{LyC}}﹩; see Section 3.1.1), while the last two objects have ﹩{f}_{\mathrm{esc}}^{\mathrm{LyC}}﹩ as upper limits.
Other Images in This Article
Show More
Copyright and Terms & Conditions
© 2022. The Author(s). Published by the American Astronomical Society.
Copyright ©
2025 Astronomy Image Explorer. All Rights Reserved.