Latest Images

Comparison of the recall estimations for each f...
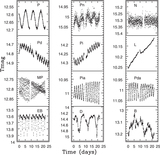
Morphological variability classes. We include s...
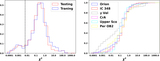
Normalized distributions of χ ...
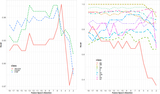
Recall values of multiclass (left panel) models...
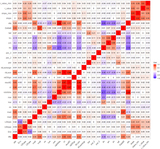
Correlation matrix of the initial 28 features c...
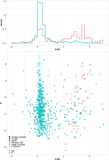
Distribution of 706 candidates to P or DB class...
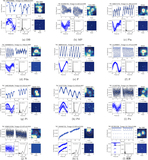
Selected LCs of single-classed stars in the tes...
Correction process done to star TIC 279581307. ...

Results of the injection-recovery test to deter...

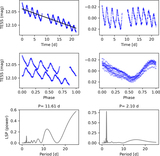
TESS 2 minute cadence photometry (left column),...

Eccentricity evolution for the three-planet mod...

RV data for HD 104067, including those acquired...

The eccentricity (top panel), tidal power (midd...

Folded TESS lightcurve, where gray points are t...

The predicted blackbody flux of TOI-6713.01, as...

Median retrieved parameters and 1σ errors acros...

Retrieved transmission spectrum for HAT-P-11b. ...

IC (measured in nats) broken down by parameter ...

IC (measured in nats) broken down by parameter ...

Retrieved scattering slope, γ, against T ...

IC (measured in nats) between the posterior and...

Retrieved cloud fraction, ...

Retrieved limb temperatures plotted against equ...

Retrieved transmission spectra for the populati...

ANNOUNCEMENTS
Take the AstroExplorer for a spin!
Be sure to try the search and sorting features, which were added based on user feedback; browse and find the links to videos and interactive figures in our Journal articles; find AAS Research Notes; or notice that new publishers have begun adding their figures to the AIE. Get in touch to hear more!