Image Details
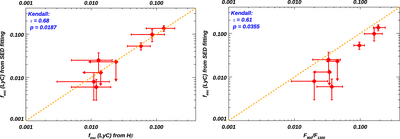
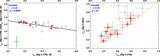
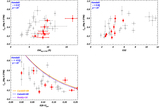
Caption: Figure 6.
﹩{f}_{\mathrm{esc}}^{\mathrm{LyC}}﹩ measured from two different methods, and comparisons with UV continuum ratios measured at 900 and 1300 Å, respectively. Left: we compare the ﹩{f}_{\mathrm{esc}}^{\mathrm{LyC}}﹩ values derived from SED fitting (Section 3.1.1) and the Hβ method (Section 3.1.2). Right: we compare the ﹩{f}_{\mathrm{esc}}^{\mathrm{LyC}}﹩ values derived from SED fitting and UV continuum flux ratios (F obs(LyC)/F(1300)). For each figure, the Kendall's τ coefficient between the x and y values and the probability of the null hypothesis (p) are shown in the upper left corner. The objects with upper limits are denoted by the arrows, where we have taken account of these upper limits in the Kendall's τ test following Akritas & Siebert (1996).
Other Images in This Article
Show More
Copyright and Terms & Conditions
© 2022. The Author(s). Published by the American Astronomical Society.