Image Details
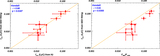
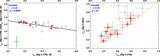
Caption: Figure 8.
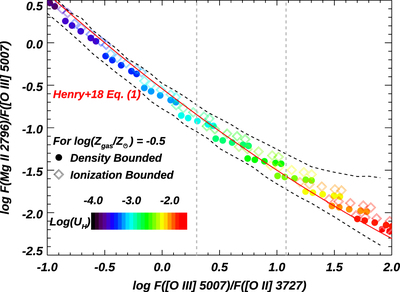
The tight correlation between the flux ratios of Mg II λ2796/[O III] and O32, which is based on the grid models from CLOUDY simulations. The input parameters are discussed in Section 3.2.1. Different colors are for different ionization parameters (log(U H)). The circles and diamonds are for the DB and IB cases, respectively. Each grid point (i.e., at certain log(U H) and gas-phase metallicity) is plotted for five stellar metallicities (Z stars = 0.001, 0.002, 0.004, 0.006, and 0.008). In these models, higher log(U H) at lower stellar metallicities moves the line ratios downward along the sequence. The two black dashed lines represent the envelopes for all grid models varying log(U H) and Z stars. The solid red line indicates the polynomial fits from Henry et al. (2018), which matches our correlations well. The galaxies discussed in this paper have O32 falling between the two gray vertical lines. This correlation for Mg II λ2803 has the same trend but differs by a factor of about 2. See details in Section 3.2.1.
Other Images in This Article
Show More
Copyright and Terms & Conditions
© 2022. The Author(s). Published by the American Astronomical Society.